Monitor Sales Stage Duration Using Time in Stage Analysis in Microsoft Teams CRM Power BI
- Marc (TeamsWork)

- Aug 1, 2025
- 3 min read
Updated: Nov 13, 2025
In sales, the most costly problems are the hidden ones. Deals that look promising on paper can stall quietly in the background, and by the time anyone notices, the momentum is already gone.
Standard pipeline reports show where a deal is. True performance, however, comes from knowing how long it's been there. This crucial insight is the foundation of Time in Stage Analysis. Without it, sales teams struggle to spot slowdowns, improve forecasting, or coach reps effectively. The CRM As A Service Power BI Dashboard brings this analysis to life, making time a visible, trackable part of your sales process.

Tracking Deal Velocity with Time in Stage Analysis
Time in Stage analysis gives sales teams a more precise view of pipeline health. Instead of just seeing how many deals are in each stage, you can measure how long each opportunity has stayed there—helping you detect slowdowns and act before momentum is lost.
With our CRM Power BI dashboard, this analysis becomes both visual and actionable. Two key reports help bring these insights to life:
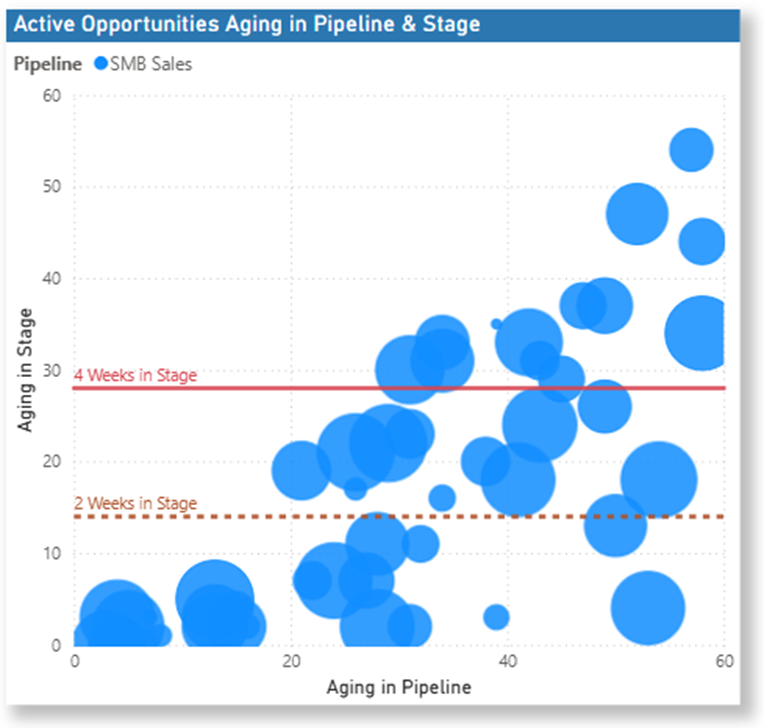
1. Opportunity Aging in Pipeline and Stage
This visual plots every opportunity by total time in pipeline (X-axis) and time spent in the current stage (Y-axis), with bubble size indicating deal value. Benchmarks like 2- or 4-week thresholds make it easy to spot which deals have been idle too long—and prioritize outreach accordingly.
2. Average Duration by Stage
This report shows how long, on average, deals stay in each stage. If you see that "Proposal" consistently takes 3x longer than "Qualification," it signals where friction may be slowing things down. These insights can prompt process improvements, SLA adjustments, or targeted coaching.

By shifting the focus from "how many" to "how long," Time in Stage helps sales leaders manage deal velocity more effectively—and keep the pipeline moving forward.
Fast, Visual, and Integrated with Microsoft Teams
Actionable insights shouldn't be reserved for data analysts. We designed our CRM As A Service dashboard to be powerful yet intuitive, functioning as a seamless Microsoft Teams CRM tool that puts critical data right where your team already collaborates. It connects directly to your existing CRM data, so there are no complex configurations or IT projects required to get started.
Once you're in, you can drill down in seconds by filtering by sales rep, pipeline, lead source, or industry to surface delays and patterns specific to your business. The visuals are fully interactive and easy to share, keeping your entire sales team aligned and focused. With CRM As A Service, any sales leader can quickly identify slowdowns, coach effectively, and keep deals moving forward.
Explore the Dashboard
The Time in Stage Analysis visual in our interactive Power BI demo highlights how long opportunities remain in each stage and reveals patterns that impact your sales performance. Gain clarity, reduce delays, and make informed decisions with real-time insights.
Discover how CRM As A Service for Microsoft Teams enhances pipeline visibility and drives better outcomes.
TeamsWork is a Microsoft Partner Network member, and their expertise lies in developing Productivity Apps that harness the power of the Microsoft Teams platform and its dynamic ecosystem. Their SaaS products, including CRM As A Service, Ticketing As A Service and Checklist As A Service, are highly acclaimed by users. Users love the user-friendly interface, seamless integration with Microsoft Teams, and affordable pricing plans. They take pride in developing innovative software solutions that enhance company productivity while being affordable for any budget.


Comments